- Psychology of Business
- Posts
- Mediation in Excel - Sobel Test in Excel (Baron & Kenny 1986 Causal Steps Approach)
Mediation in Excel - Sobel Test in Excel (Baron & Kenny 1986 Causal Steps Approach)
Conduct a Sobel Test in Excel Using This Calculator
Brandon Griffin
September 11, 2023
Mediation Analysis with Sobel
Mediation analysis exists to assess if there is a third or intervening variable between the relationship of the Independent Variable (X) and the Dependent Variable (Y). A popular method for assessing mediation is the Sobel test. Despite the shortcomings of this approach, the Sobel test is often one of the first methods learned when assessing mediation.
For this analysis, assume that our Independent Variable (X) is Well-Being and our Dependent Variable (Y) is Job Performance. Additionally, our Mediating Variable (M) is Job Engagement. We need to assess the relationship between Well-Being (X) on Job Engagement (M). Additionally, we need to examine the impact of Job Engagement (M) on Job Performance (Y) when including Job Satisfaction (X) as a predictor. Let’s examine the Sobel Test.

The classic Baron and Kenny (1986) article laid out the causal steps approach to mediation. First, assess the relationship between IV and DV. Second, assess the relationship between IV and M. Third, assess the relationship between M and Y, while including X as a predictor. Lastly, assessing if full or partial mediation has occurred based on whether the X to Y relationship is no longer statistically significant (Full Mediation) or if it has simply been reduced (Partial Mediation). The “traditional version” of the Sobel statistic is calculated as Sobel Statistic = a*b/SQRT(b²*Sa² + a²*Sb²). This is the formula used by Kristopher Preacher on his website QuantPsy.org. Now the denominator, or the standard error formula differs according to which version of the formula will be used, we will be using the above formula. The resulting Sobel Z statistic is a “critical ratio as a test of whether the indirect effect of the IV on the DV via the mediator is significantly different from zero”. - http://quantpsy.org/sobel/sobel.htm
Sobel in Excel
I want to note that much of this calculator is based on prior work by Ruben Geert van den Berg (https://www.spss-tutorials.com/sobel-test-what-is-it/). I have adapted and added to his calculator, but note that while preparing my tool, I came across his and thought it looked great, so I incorporated it into my tool. In reality, I mainly just build on top of his tool.
First, you need to enable the Data Analysis Toolpak in Excel to perform the regression. To do this go to File > Options > Add-ins > Analysis Tookpak.
Second, you will see that there are five separate worksheets in this Excel workbook. The first is the instructions. The second is the calculator, the third is your first regression (X to Y), the fourth is your second regression (X to M), and the fifth is your third regression (X and M to Y).

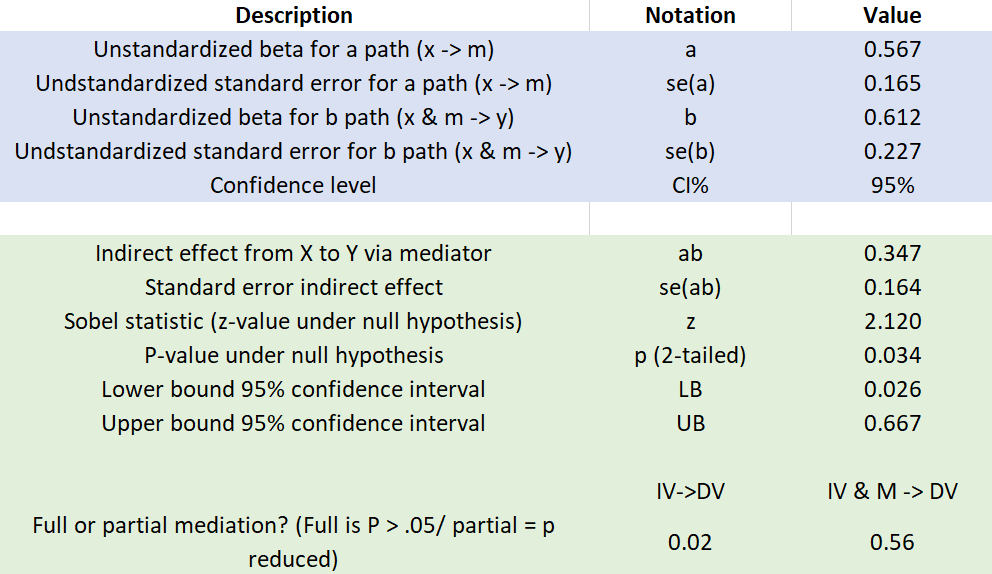
The in blue will be automatically referenced based on your regression analyses, and the resulting statistics will be outputted in green. Please note that for the calculator to auto-calculate, the regression output must be entered on Cell E1 of sheets “IV → DV”, “IV → M”, and “IV & M → DV”. Alternatively, you can just enter the arguments manually in the blue (copy and paste).
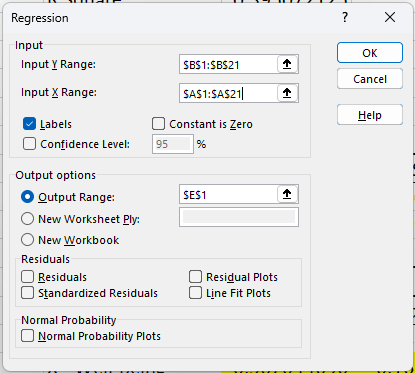
Third, you need to calculate each of the two regression analyses. The first regression is an analysis of the Independent Variable (X) Well-Being on the Mediating Variable (M) Job Engagement. To do this, run a regression analysis on the worksheet “IV → M”. Data > Data Analysis > Regression > Input Y Range ($B$1:$B$21) > Input X Range ($A$1:$A$21) > Yes Labels > Output Range $E$1 > OK.
The resulting output shows the unstandardized regression coefficient (a) as 0.567 (rounded) and the standard error (Sa) as 0.165 (rounded). These numbers should auto-populate into the calculator.

Next, we need to run a multiple regression where the Independent Variable (X) Well-Being and the Mediating Variable (M) Job Engagement are both predictors of the Dependent Variable (Y) Job Performance. You will be inputting the data from job Job Engagement. To do this, run a regression analysis on the worksheet “IV & M→ DV”. Data > Data Analysis > Regression > Input Y Range ($C$1:$C$21) > Input X Range ($A$1:$B$21) > Yes Labels > Output Range $E$1 > OK. The input range of both columns tells Excel that each column is its own variable. Note that multiple independent variables must be next to each other in Excel for the regression to run properly.
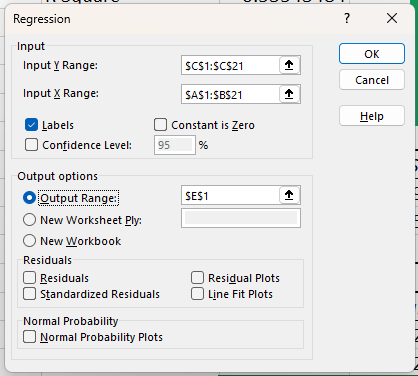

The resulting output shows the unstandardized regression coefficient (b) as 0.612 (rounded) and the standard error (Sb) as 0.227 (rounded). These numbers should auto-populate into the calculator.
Now that we have all of our data, we can begin to calculate the Sobel Statistic. The numerator is a*b. The denominator is SQRT(b²*Sa² + a²*Sb²). The Sobel Statistic is Numerator/Denominator. From QuantPsy.org, the accompanying P-Value is “drawn from the unit normal distribution under the assumption of a two-tailed z-test of the hypothesis that the mediated effect equals zero in the population”.
Based on the analysis of our results, and a p-value of less than .05, signifying that the indirect effect of X on Y via the mediator has support. Thus, we can imply that we have mediation, or that Job Engagement (M) mediates the relationship between Well-Being (X) and Job Performance (Y). Additionally, because the 95% confidence interval does not contain zero, we have statistical significance.

Full vs. Partial Mediation
Now, if the relationship between the X and Y variables is no longer statistically significant, we have full mediation. Whereas, if the relationship is reduced, we have partial mediation. Based on our analysis, we have full mediation. This is because when we run a regression on “IV → DV” assessing the relationship between the IV and DV, we get a P-value for the IV of 0.02 (rounded). After assessing that same relationship in the presence of the mediator “IV & M → DV” the P-value for the IV is only 0.56 (rounded). Thus, the relationship is no longer statistically significant in the presence of the mediator, signifying full mediation.


Data File. Please download, do not request access:
https://docs.google.com/spreadsheets/d/1gH6Y8EIUkmZZmPYKXsgcOfl2IHW-TCUQ/edit?usp=sharing&ouid=112689421649963944674&rtpof=true&sd=true
Thank you for reading, Please let me know if you have any questions, comments, or concerns (or if I made a mistake in my video or article)!
References
MacKinnon, D. P., Lockwood, C. M., Hoffman, J. M., West, S. G., & Sheets, V. (2002). A comparison of methods to test mediation and other intervening variable effects. Psychological methods, 7(1), 83.
Baron, R. M., & Kenny, D. A. (1986). The moderator–mediator variable distinction in social psychological research: Conceptual, strategic, and statistical considerations. Journal of personality and social psychology, 51(6), 1173.
Ruben Geert van den Berg
Reply